Features
Managed Kubernetes Platform
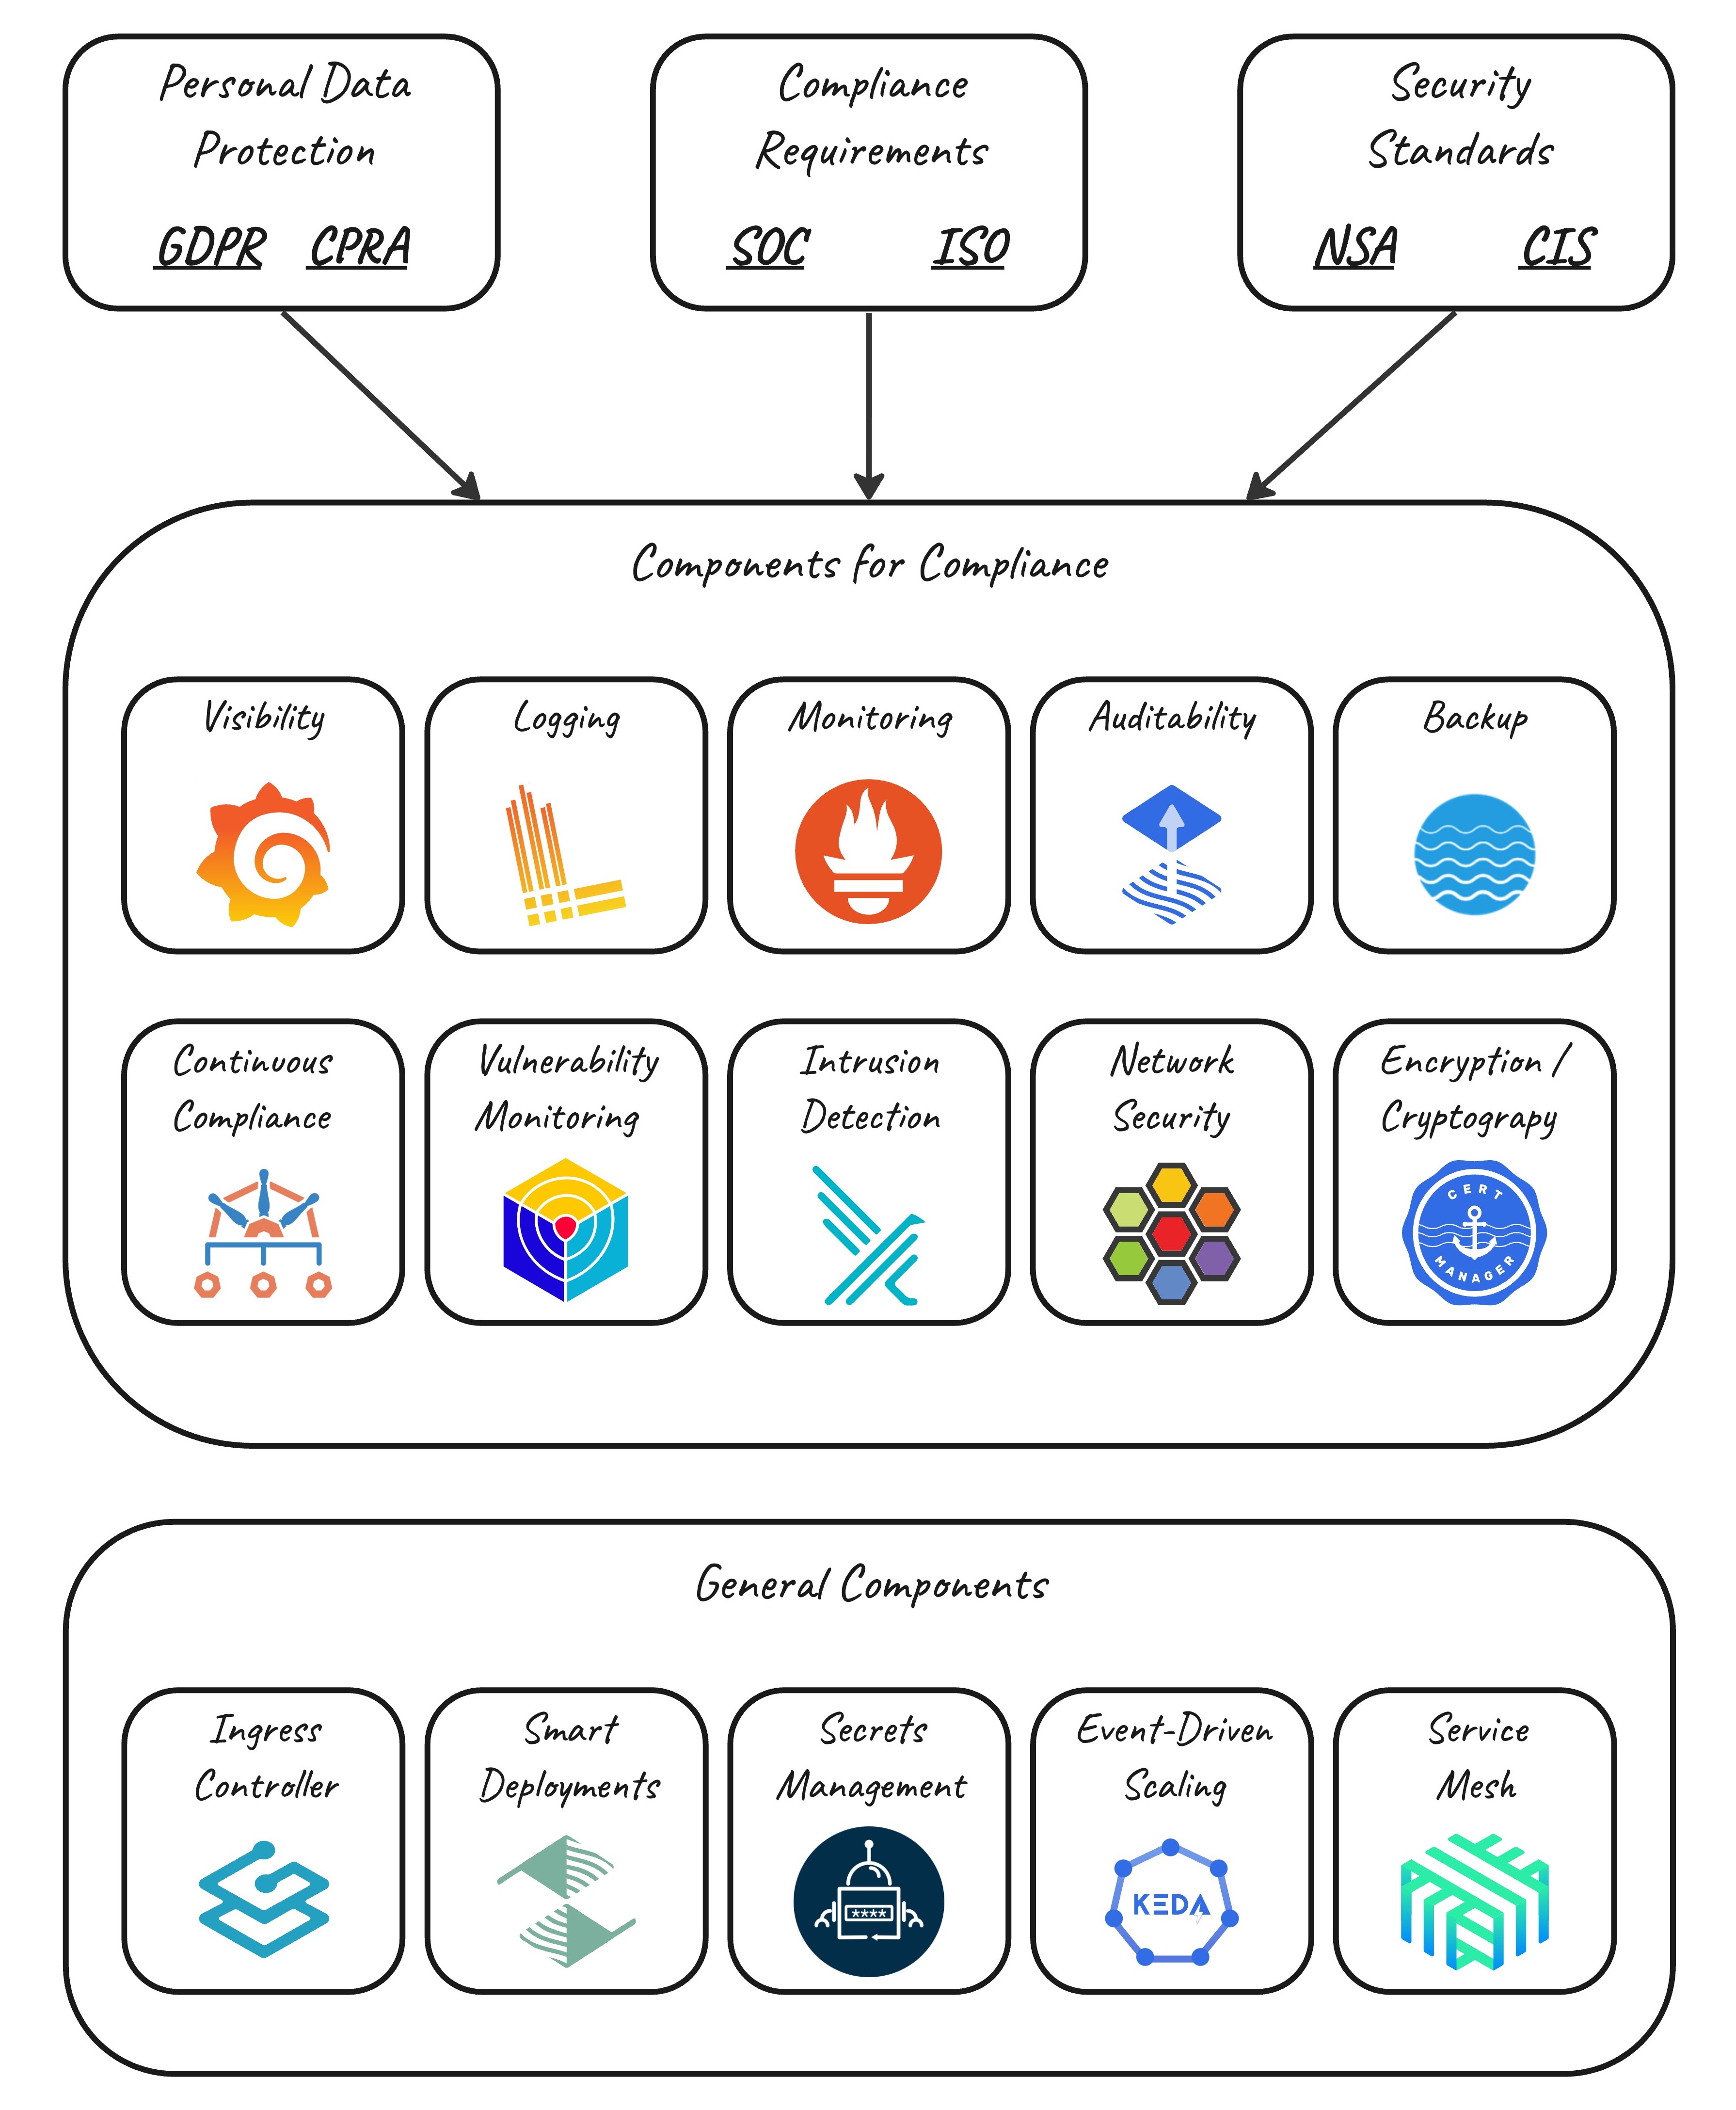
kspacr Namespaces can benefit from a suite of managed Kubernetes Add-Ons that form a sophisticated Platform and are needed by most Kubernetes deployments. It can be difficult to select the best of their respective category, and even more time-consuming to properly configure and maintain them.
Collectively, these services can consume a substantial amount of CPU and memory resources, which is often considered a hidden ocst of running workloads on Kubernetes. However, at kspacr, these services are available free of charge, which can significantly reduce your operational costs.
Network
Traefik: Ingress Controller
Traefik is a modern HTTP reverse proxy and load balancer that is designed to make deploying microservices easy. It takes care of all the networking complexities and routes HTTP requests to the correct services based on their configuration.
One of the standout features of Traefik is its middleware functionality. Middleware in Traefik is a mechanism that allows users to customize the way requests and responses are handled. This includes tasks like adding, removing, or modifying request and response headers, circuit breakers, automatic retries, buffering, response compression, or even applying rate limits to your services.
Linkerd: Service Mesh
Linkerd is a service mesh that is designed to be ultra-light, simple, and powerful. It adds security, observability, and reliability to Kubernetes without adding complexity. It's hosted by the Cloud Native Computing Foundation (CNCF).
Linkerd provides instant platform health metrics, allowing you to track success rates, latencies, and request volumes for every meshed workload without any changes or configuration. It also offers zero-config mutual TLS, which transparently adds mutual TLS to any on-cluster TCP communication with no configuration.
How can Linkerd be useful for you?
- Enhanced Observability: provides instant platform health metrics, allowing you to track success rates, latencies, and request volumes for every meshed workload. This can help you monitor and troubleshoot your applications effectively.
- Improved Security: offers zero-config mutual TLS, which transparently adds mutual TLS to any on-cluster TCP communication. This enhances the security of your applications by ensuring secure communication.
- Reliability: provides reliability features like latency-aware load balancing, request retries, timeouts, and blue-green deploys. These features help keep your applications resilient.
- Simplicity: is designed to be simple and easy to use. It has a minimalist, Kubernetes-native design with no hidden magic and as little YAML and as few CRDs as possible.
Cilium: Network Security and Observability
Cilium is like a Swiss army knife for networking, observability, and security for your cloud-native applications. It leverages the power of eBPF, a technology built into the Linux kernel, to provide these services at a granular level without compromising on performance. Cilium can be used to secure network connectivity between application services.
cert-manager: TLS/SSL certificates
cert-manager simplifies and automates the process of using Transport Layer Security (TLS) certificates in Kubernetes. TLS certificates are used to secure network communications and establish the identity of websites over the Internet. It manages the certificates for all your service domains, ensuring they are always up-to-date and valid.
In simpler terms, cert-manager is like a helper that takes care of all the complexities of obtaining and renewing free certificates and properly injecting them into your Kubernetes Ingress resources.
Applications
Flagger: Smart Deployments
Flagger is like a traffic controller for your software releases. It gradually shifts traffic to the new software version while measuring key metrics such as HTTP/gRPC request success rate and latency. If these metrics meet the defined criteria, Flagger continues to shift more traffic to the new version. If not, it rolls back to the previous version, ensuring the stability of your services.
How can Flagger be useful for you?
- Safer Releases: Flagger reduces the risk associated with deploying new software versions by gradually shifting traffic to the new version and monitoring key metrics. This allows for safer, more controlled releases.
- Flexible Traffic Routing: Flagger can shift and route traffic between app versions using a service mesh or an Ingress controller, providing flexibility in how you manage your traffic.
- Extensible Validation: Besides the built-in metrics checks, Flagger allows for extended application analysis with custom metrics and webhooks. This means you can run acceptance tests, load tests, or any other custom validation as part of your release process.
- Automated Rollbacks: If Flagger detects a problem with the new version based on the metrics it monitors, it can automatically roll back to the previous version, ensuring the stability of your services.
- Integration with GitOps: Flagger can be used with Flux to build fully automated GitOps pipelines for canary deployments. This allows for a declarative approach to managing your deployments, with Git serving as the single source of truth.
Flux: GitOps workflow
Flux is like a synchronizer between your Git repositories and your Kubernetes Namespaces. It continuously monitors your Git repositories for changes and applies those changes to your namespaces. This means that you can manage your Kubernetes configuration in Git, and Flux will ensure that your namespaces are always in sync with that configuration.
How can Flux be useful for you?
- Automated Synchronization: Flux automates the process of keeping your Kubernetes namespaces in sync with your Git repositories. This means that you can manage your namespace configuration in Git, and Flux will take care of applying those changes to your namespaces.
- Declarative Approach: With Flux, you define the desired state of your namespaces in Git, and Flux ensures that your namespaces match this state. This declarative approach simplifies namespace management and reduces the risk of configuration drift.
- GitOps Workflow: Flux enables a GitOps workflow, where all changes are made in Git and automatically applied to your namespaces. This provides a clear audit trail of changes and allows for easy rollbacks if needed.
- Auditability: By keeping the entire state of the system in Git, you have an audit log of what changed and who changed it. Each change is tracked with a commit hash, making it easy to pinpoint exactly what changes were made.
Coming soon
kspacr employs Flux to handle various elements of your managed namespaces. We are currently exploring the most effective and secure method to provide our users with access to Flux.
External Secrets Operator
External Secrets Operator is a Kubernetes operator that bridges the gap between Kubernetes and external secret management systems such as AWS Secrets Manager, HashiCorp Vault, Google Secrets Manager, Azure Key Vault, IBM Cloud Secrets Manager, and many others. It functions by fetching information from these external APIs and automatically injecting the values into a Kubernetes Secret.
In simpler terms, External Secrets Operator is like a courier that fetches secrets from your external secret management system and delivers them safely to your Kubernetes Namespace. It does this by creating Kubernetes Secrets from the data it retrieves from the external system.
KEDA: Event-driven Autoscaling
KEDA is essentially a Kubernetes-based Event Driven Autoscaler. It allows you to automatically scale any container in Kubernetes based on the number of events that need to be processed. It's a lightweight and single-purpose component that can be added to any Kubernetes cluster. KEDA works alongside standard Kubernetes components like the Horizontal Pod Autoscaler.
How can KEDA be useful for you?
- Event-Driven Autoscaling: KEDA enables intelligent scaling of your event-driven applications. This means your applications can scale up when there's a high number of events to process, and scale down when the event load is low.
- Built-in Scalers: KEDA comes with a catalog of 50+ built-in scalers for various cloud platforms, databases, messaging systems, telemetry systems, CI/CD, and more. This makes it easy to integrate KEDA with your existing tools and platforms.
- Multiple Workload Types: KEDA supports a variety of workload types such as deployments, jobs, and custom resources with
/scalesub-resource. This makes it a flexible solution for managing different types of workloads in your Kubernetes namespace.
Velero: Data Backup & Protection
Velero is the safety net for the Kubernetes resources in your namespace. It allows you to take backups of your namespace and restore them in case of loss. But that's not all - Velero also enables you to migrate cluster resources to other clusters and replicate your production cluster to development and testing clusters.
How can Velero be useful for you?
- Backup and Recovery: provides robust backup and recovery capabilities for your namespace. This ensures that you can quickly recover your applications and data in case of any accidental deletions.
- Cluster Migration: allows you to easily migrate resources from one cluster to another. This can be particularly useful when you're moving applications from development to production, or when you're transitioning to a new cluster.
Security
Kyverno: Policy Manager
Kyverno is like a rule-setter and enforcer for your Kubernetes Namespace. It allows you to define policies that dictate how your Namespace should behave. These policies can be used to validate and mutate resources, enforce best practices, and prevent configuration errors.
How can Kyverno be useful for you?
- Policy Enforcement: can enforce best practices and standards across all your namespaces in a cluster. This ensures consistency and prevents misconfigurations that could lead to security vulnerabilities or operational issues.
- Dynamic Configuration Management: policies are Kubernetes resources, which means they can be managed just like any other Kubernetes object. This makes it easy to version control your policies and apply them across different environments.
- Resource Validation and Mutation: can validate resources against policies before they are created, and it can also mutate resources to align with policy requirements. This can help prevent the creation of non-compliant resources.
- Automated Resource Generation and Cleanup: can automatically generate resources based on policy definitions, and it can clean up resources when they are no longer needed. This can help to keep your cluster clean and well-organized.
- Policy Testing and Reporting: provides tools for testing policies and generating reports on policy enforcement. This can help you to understand the impact of your policies and identify any issues.
Automatically applied Policies
kspacr automatically applies a set of policies to make sure that namespace isolation is properly enforced and that no application having insecure settings gets deployed inside the namespace.
Trivy: Vulnerability Monitoring
Trivy is like a security guard for your code and applications. It can scan various targets such as container images, and Kubernetes configurations. It looks for security issues in these targets, including known vulnerabilities (CVEs), misconfigurations, sensitive information, and secrets.
How can Trivy be useful for you?
- Vulnerability Scanning: identify known vulnerabilities in your applications and infrastructure, helping you to secure your Kubernetes namespaces.
- Misconfiguration Detection: detect misconfigurations in your Infrastructure as Code (IaC) files, helping you to avoid potential security issues.
- Secret Detection: identify sensitive information and secrets in your code and configurations, helping you to prevent accidental exposure of sensitive data.
Coming soon
We are currently working on an easier way to access the reports through the kspacr Namespace Dashboard.
Falco: Intrusion Detection
Falco is a security watchdog for your namespace. It monitors system calls in real-time, parsing the calls stemming from your namespace, and asserts the stream against a powerful rules engine. If a rule is violated, it sends out an alert. This allows you to detect and respond to any abnormal behavior or policy violations, enhancing the security of your namespace.
Monitoring
Metrics Server
Metrics Server is like a data collector for your Kubernetes clusters. It gathers key performance metrics from each node's Kubelet and makes them available to other parts of your Kubernetes system through the Metrics API.
How can Metrics Server be useful for you?
- Resource Monitoring: Metrics Server provides key metrics about the resource usage of your deployments and pods, helping you monitor the performance of your applications and optimize resource allocation.
- Autoscaling: The metrics provided by Metrics Server are used by Kubernetes for autoscaling functions. This means that Metrics Server plays a key role in ensuring that your applications can scale up or down based on their resource usage.
- Debugging: The metrics provided by Metrics Server can also be accessed using kubectl top, making it easier to debug issues related to resource usage.
Dashboard
Kubernetes Dashboard is like a control panel for your Kubernetes namespaces. It provides a graphical interface that allows you to deploy containerized applications to a Kubernetes namespace, troubleshoot your applications, and manage the cluster resources. You can use it to get an overview of applications running in your namespace, as well as to create or modify individual Kubernetes resources such as Deployments, Jobs, etc.
How can Kubernetes Dashboard be useful for you?
- Ease of Use: With its graphical interface, Kubernetes Dashboard makes it easier to manage your Kubernetes namespace, even if you're not familiar with Kubernetes' command-line interface.
- Monitoring: Kubernetes Dashboard provides a visual representation of your namespace, making it easier to monitor the status of your applications and resources.
- Troubleshooting: If something goes wrong in your namespace, Kubernetes Dashboard can help you identify and fix the problem. It provides detailed information about your applications and resources, as well as any errors that may have occurred.
- Resource Management: Kubernetes Dashboard allows you to manage your namespace resources. You can create, update, and delete resources, and view detailed information about each resource.
- Access to Logs: Kubernetes Dashboard provides an integrated
logs viewer. This allows users to inspect the logs of their pods directly from the dashboard, making it easier to troubleshoot issues and understand the behavior of their applications. - Shell Access to Pods: Another powerful feature of the Kubernetes Dashboard is the ability to shell into pods. This provides users with a command-line interface for interacting directly with the containers in their pods, which can be invaluable for debugging and exploration.